IV Curve Test for Solar Cells: Characteristics, Methods, and Applications
IV Curve Test for Solar Cells: Characteristics, Methods, and Applications
1. Introduction to IV Curve Test
The IV (current-voltage) curve test is a fundamental diagnostic tool for evaluating solar cell performance, providing a graphical representation of how current output varies with applied voltage under illumination. This test has become increasingly sophisticated with modern instrumentation that offer automated scanning, real-time control, and data export capabilities. As solar cell technologies advance, particularly with the emergence of perovskite and BC (back-contact) cells, IV curve analysis remains essential for performance characterization and quality control in both research and manufacturing settings.
2. Characteristics of IV Curves
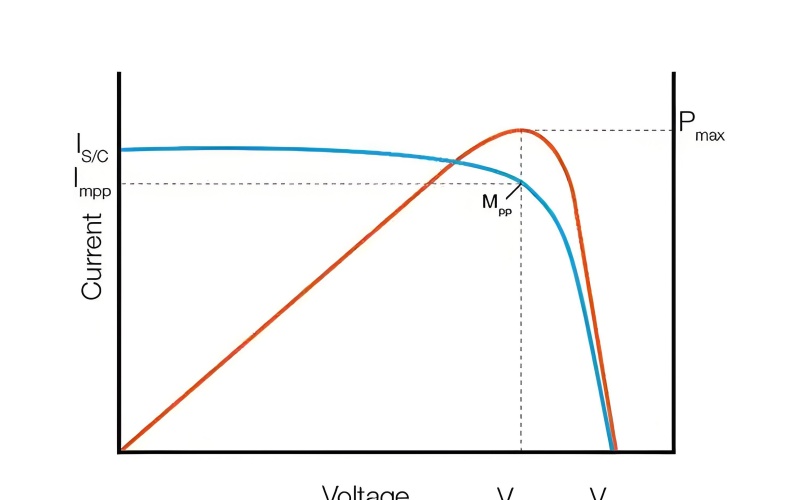
2.1 Normal IV Curve Features
A typical solar cell IV curve under standard test conditions (STC: 1000 W/m², AM1.5 spectrum, 25°C) exhibits distinct features:
Feature | Description | Significance |
Short-circuit current (I<sub>sc</sub>) | Current at zero voltage (y-intercept) | Measures maximum photocurrent generation |
Open-circuit voltage (V<sub>oc</sub>) | Voltage at zero current (x-intercept) | Reflects built-in potential of junction |
Maximum power point (MPP) | Point where V×I product is maximized | Determines optimal operating conditions |
Fill factor (FF) | Ratio: (P<sub>max</sub>)/(V<sub>oc</sub>×I<sub>sc</sub>) | Indicates quality of junction and series resistance |
The curve typically shows a "knee" shape where current remains relatively constant until approaching V<sub>oc</sub>, then drops sharply. High-performance cells maintain current closer to V<sub>oc</sub>, resulting in a more "square" curve with higher FF .
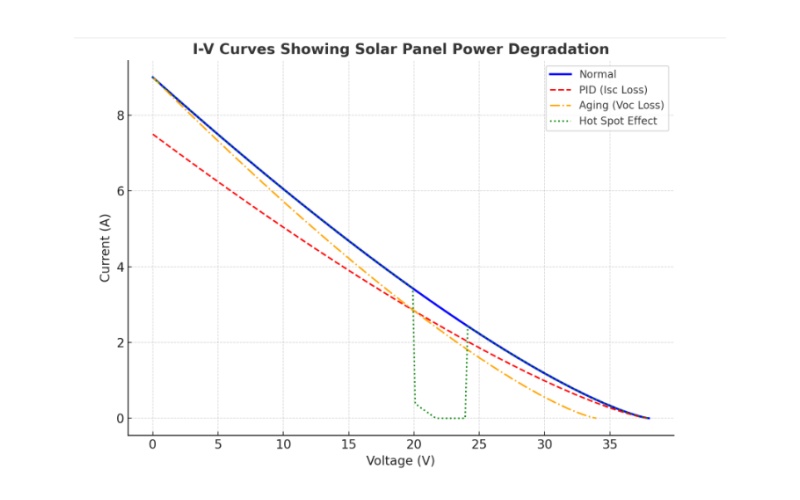
2.2 Abnormal IV Curve Patterns
Recent studies from IEA-PVPS Task 13 have catalogued IV curve abnormalities in emerging technologies :
S-shaped curves: Common in perovskite cells, indicating carrier transport barriers
Multiple steps: Suggest current collection issues from cell segmentation or interconnection failures
Low FF with normal I<sub>sc</sub>/V<sub>oc</sub>: Typically caused by high series resistance or shunting
Current limiting plateaus: Often seen in partial shading or cracked cells
Chinese researchers have developed patent-pending methods to locate problematic cells in modules based on IV curve anomalies, particularly useful for large-scale solar farms .
3. Advanced Testing Methodologies
Modern IV curve tracers offer capabilities beyond basic characterization:
3.1 Equipment Advancements
Keithley's IV curve tracer software transforms source measurement units (SMUs) into full-featured curve tracers with:
· Real-time control via front-panel knobs (virtual or physical)
· Dynamic zooming during measurement
· Automated breakdown voltage detection
· CSV export for further analysis
3.2 Specialized Testing Protocols
Recent developments include:
Light-biased IV testing: For evaluating perovskite and organic cells under operational conditions
Transient IV analysis: Capturing performance changes during rapid light intensity variations
Spatially-resolved IV: Combining with luminescence imaging to correlate local defects with global performance
4. Applications in Solar Industry
4.1 Performance Benchmarking
The 2025 PV industry report highlights how IV curve parameters are used to compare technologies:
Technology | Typical V<sub>oc</sub> (V) | FF (%) | Notes |
PERC | 0.68-0.70 | 80-82 | Current mainstream technology |
TOPCon | 0.70-0.72 | 81-83 | Gaining market share |
HJT | 0.72-0.75 | 80-82 | Preferred for overseas expansion |
BC | 0.68-0.70 | 82-84 | Higher efficiency potential |
Perovskite | 1.10-1.20 | 75-80 | Rapid efficiency improvements 21 |
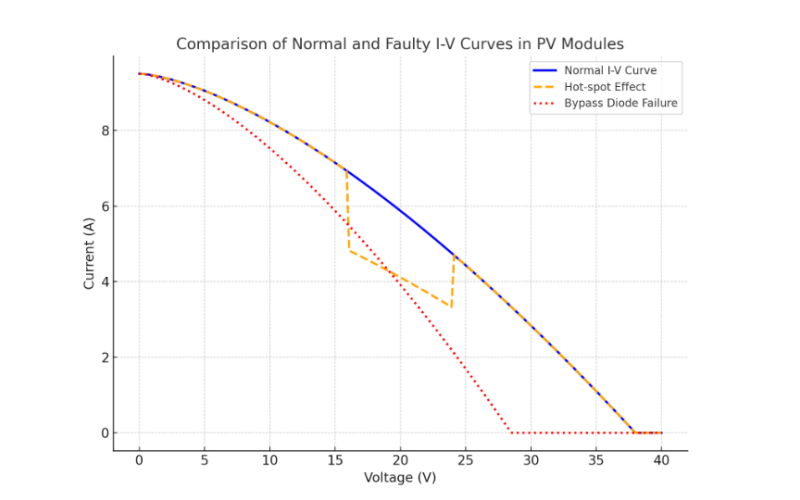
4.2 Fault Detection and Analysis
IV curve test is critical for:
· Identifying manufacturing defects (e.g., shunts, broken fingers)
· Detecting field failures (e.g., potential-induced degradation)
· Evaluating degradation mechanisms in new technologies
The IEA-PVPS Task 13 report emphasizes that IV analysis combined with complementary techniques like EL or IR imaging provides the most comprehensive failure analysis .
5. Future Trends
AI-assisted analysis: Machine learning algorithms are being developed to automatically classify IV curve patterns and predict failure modes
High-throughput testing: Automated systems for rapid IV characterization in manufacturing lines
Multi-junction analysis: Advanced techniques for characterizing perovskite/silicon tandem cells
Climate-specific modeling: Correlating IV parameters with performance under various weather conditions